
Simply staggering: Rapidly developing ‘super El Niño’ on track to peak in December

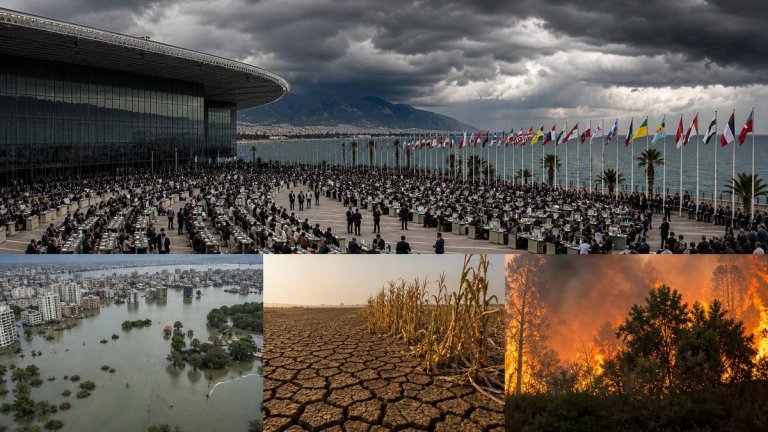
Meteorologists have been watching the Pacific since spring. The numbers now are hard to ignore. Sea surface temperatures in the Niño 3.4 region, the benchmark zone for tracking this phenomenon, have climbed more than 1.5°C above the long-term average. That threshold matters. Cross it, and you’re officially in El Niño territory. Keep climbing, and you enter the realm of the so-called super El Niño, events so powerful they reshape weather patterns across entire continents.
This isn’t a slow burner. Oceanic and atmospheric conditions are aligning faster than many models predicted back in March. The World Meteorological Organization issued a formal El Niño advisory in July, months ahead of typical declaration timelines. By August, Australia’s Bureau of Meteorology and NOAA’s Climate Prediction Center were in agreement: this event is intensifying quickly, with peak impacts likely arriving in December 2023.
What Makes a Super El Niño Different
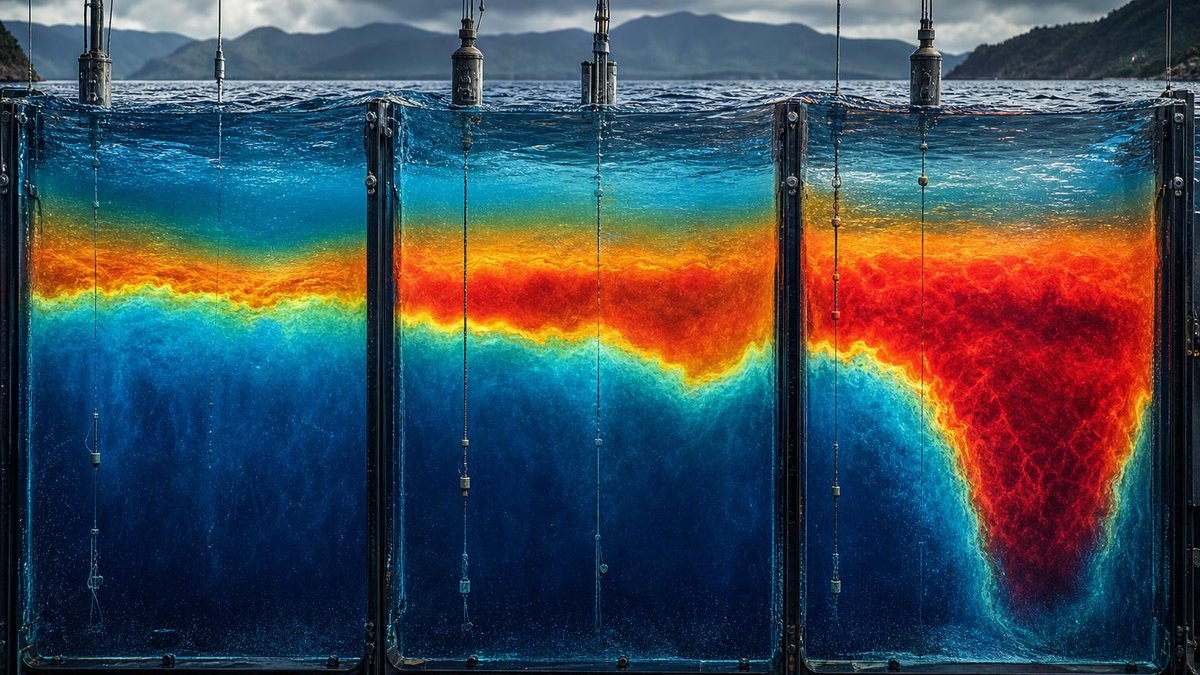
Not all El Niño events are created equal. The cycle itself, part of the broader El Niño-Southern Oscillation (ENSO), flips between warm (El Niño), cool (La Niña), and neutral phases every two to seven years. Most episodes are moderate. Sea temperatures warm by a degree or so, rainfall shifts modestly, and the world notices but adapts.
Then there are the outliers.
The 1997-98 and 2015-16 events both pushed Niño 3.4 anomalies beyond 2.0°C, and in some weekly readings, closer to 2.5°C. Those super El Niño years brought catastrophic flooding to Peru, drought and fires to Indonesia, and disrupted monsoons across South Asia. Global temperature records fell. The 2015-16 event helped make that year the hottest on record at the time, a benchmark since eclipsed but still standing as a signature of what these events can do when they peak during the Northern Hemisphere winter.
What distinguishes a super El Niño isn’t just magnitude but speed. The ocean-atmosphere feedback loop, where warm surface waters reduce trade winds, which then allows more warming, can either ramp gradually or accelerate dramatically. This year, the feedback kicked in hard and early. Subsurface warm water, built up during three consecutive La Niña years, rose to the surface in a concentrated burst rather than dispersing gradually.
Why December Matters for the Peak
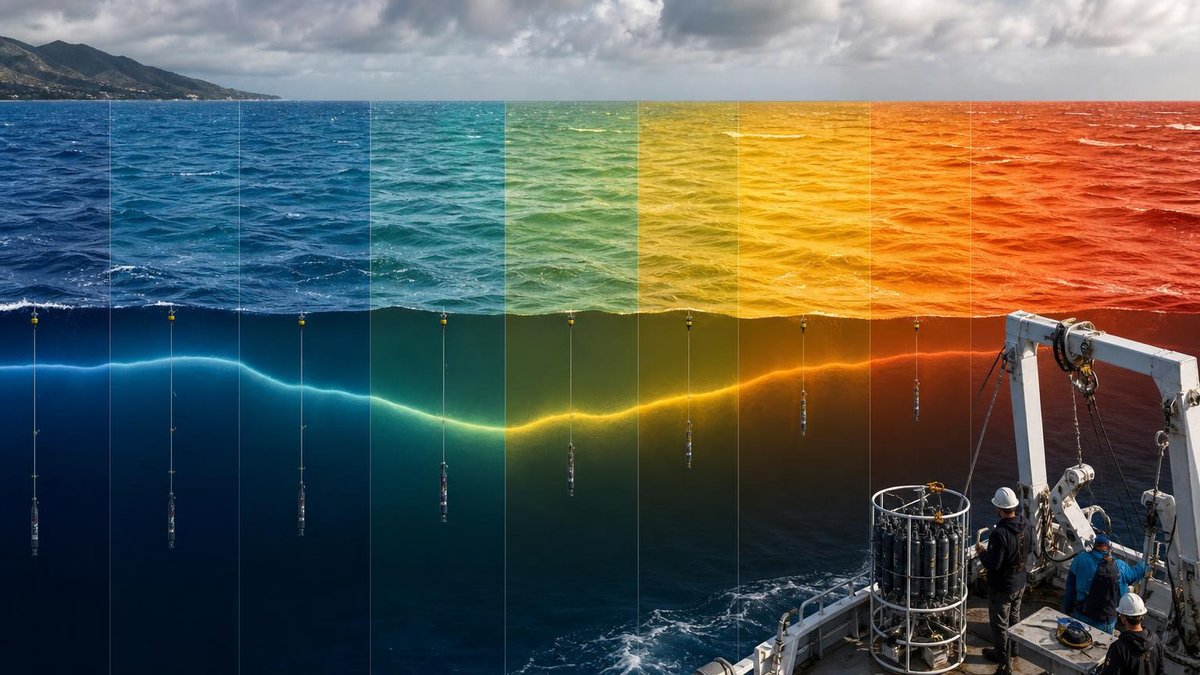
El Niño events typically peak during November through January, when the Southern Hemisphere warms into summer and the Pacific’s thermocline is most responsive to atmospheric forcing. A December peak is textbook normal. What’s not normal is the rate of development we’re seeing in 2023.
NOAA’s September 2023 outlook placed the odds of a strong El Niño at 71% for the November-January period, up from roughly 50% in early summer. The agency’s criteria for “strong” means Niño 3.4 anomalies exceeding 1.5°C, a threshold this event had already touched by late August in some weekly datasets.
The timing carries real consequences. A December peak means the Northern Hemisphere winter will unfold under El Niño’s influence. For the United States, that historically translates to wetter conditions across the southern tier, from California through the Gulf Coast, and warmer, drier weather in the Pacific Northwest and northern Rockies. For regions already stressed by climate change, these shifts compound existing vulnerabilities.
Consider the agricultural calendar. Winter wheat planting in the southern Plains, citrus harvesting in Florida and California, and the critical snowpack buildup in the Sierra Nevada all intersect with December-January weather. El Niño’s fingerprint on these months can make or break crop yields, reservoir levels, and wildfire risk for the following year.
Global Warming and the El Niño Connection

Here’s where the conversation gets complicated, and where honest science requires care. El Niño itself is a natural cycle. It existed long before human greenhouse gas emissions, and it’ll continue regardless of what we do about fossil fuels. But the context in which it now operates has fundamentally changed.
The global warming El Niño connection isn’t about causing the event. It’s about amplification. Baseline ocean temperatures are higher now. The atmosphere holds more moisture. Superimpose the same El Niño perturbation on a warmer planet, and you get greater extremes than decades ago.
IPCC assessment reports have addressed this repeatedly. The Sixth Assessment Report, Working Group I, found with high confidence that human influence has warmed the climate system, and that this warming affects the intensity and impacts of ENSO-related variability even if the core frequency remains within historical bounds. In practical terms: the 2023-24 El Niño may not exceed 1997-98 or 2015-16 in raw Niño 3.4 numbers, but its effects on temperature and precipitation could still set records because the starting point is so much higher.
Who Gets Hit Hardest
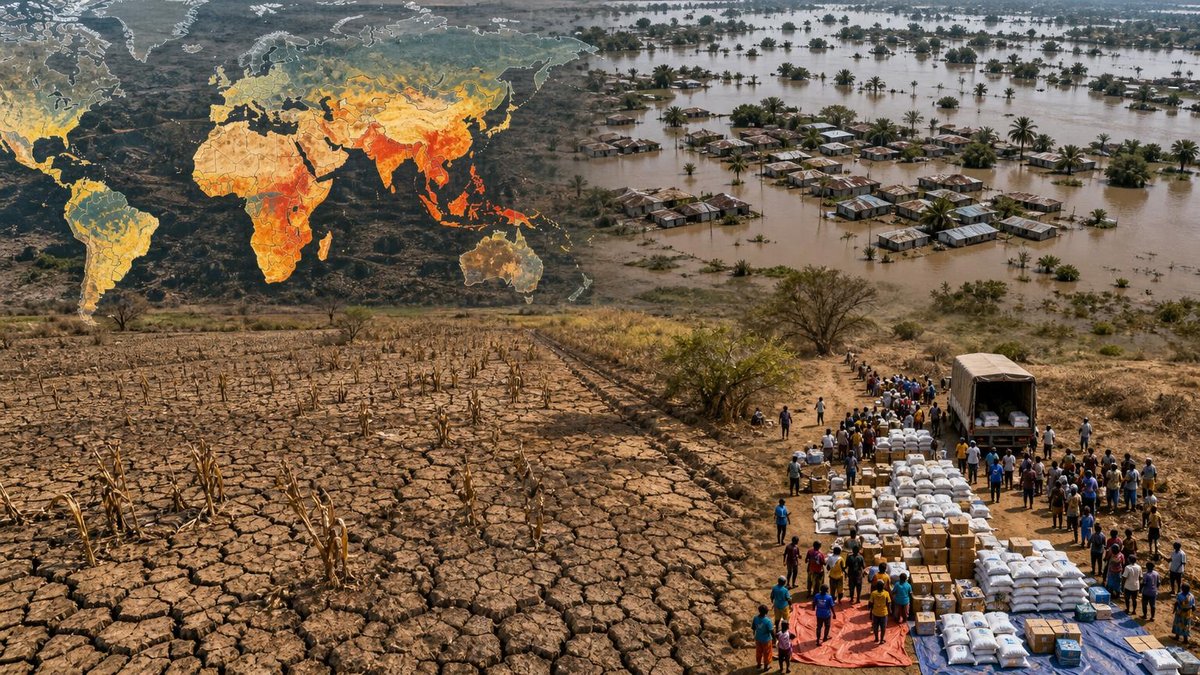
El Niño’s impacts aren’t evenly distributed. Some regions see modest changes; others face existential stress to food security, water supplies, and public health. Understanding this distribution matters for preparedness, and it matters for climate justice.
The countries most vulnerable are often those with the least capacity to adapt. This includes many rapidly developing countries, where economic growth has lifted millions from poverty but infrastructure and institutional resilience lag behind exposure to climate shocks. Rapidly developing economy countries in Southeast Asia, East Africa, and Central America face particular risks: their agricultural sectors remain heavily rain-fed, their urban centers are expanding into flood-prone areas, and their health systems struggle with surges in climate-sensitive diseases.
Among the most rapidly developing countries, India exemplifies the tension. Its economy has grown at among the fastest rates globally, yet roughly 40% of employment still depends on agriculture. El Niño historically correlates with weakened Indian summer monsoons, though the relationship is noisy and modulated by other factors. A failed or delayed monsoon during a strong El Niño year can spike food prices, depress rural incomes, and trigger government relief spending at scales that strain federal budgets.
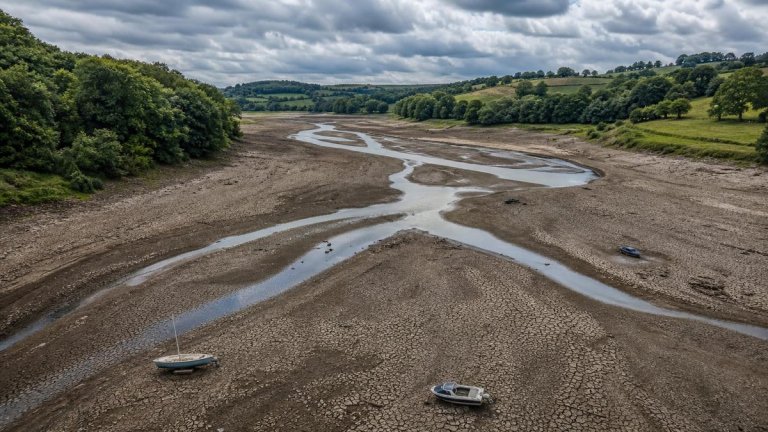
Indonesia and Malaysia face different but equally serious pressures. El Niño’s atmospheric teleconnections typically suppress rainfall across the maritime continent, extending fire seasons and degrading air quality to hazardous levels. The 2015-16 super El Niño produced peatland fires that released carbon emissions rivaling some industrial nations’ annual output, with smoke causing an estimated 100,000 premature deaths across the region according to subsequent epidemiological studies.
Urban areas in rapidly developing suburbs face compounded risks. Take Porur, Chennai, a rapidly developing suburb that has transformed from semi-rural periphery to dense residential and IT corridor in two decades. Its stormwater infrastructure wasn’t designed for the rainfall intensities that El Niño-plus-climate-change can deliver. The 2015 Chennai floods illustrated how quickly water can overwhelm such areas when meteorological extremes intersect with rapid, often unplanned, urbanization.
The following table summarizes key El Niño impacts by region:
| Region | Typical El Niño Impact | Historical Severity Reference |
|---|---|---|
| Eastern Australia | Below-average rainfall, increased bushfire risk | 2015-16: Record warmth, early fire season onset |
| Amazon Basin | Dry season intensification, fire risk | 2015-16: Severe drought in eastern Amazon |
| Southern United States | Above-average winter precipitation | 1997-98: California flooding, $550 million agricultural losses |
| East Africa | Enhanced October-December “short rains” | 1997: Catastrophic flooding in Somalia, Kenya |
| Maritime Southeast Asia | Suppressed rainfall, fire and haze | 2015: Regional haze crisis, 2.6 million hectares burned in Indonesia |
Sources: NOAA Climate Prediction Center historical event summaries; IPCC AR6 regional fact sheets; Indonesian Ministry of Environment and Forestry reports on 2015 fires.
Preparing for What Comes Next
Forecasting El Niño has improved dramatically. The 1982-83 super El Niño struck with minimal warning; today’s seasonal prediction models offer actionable lead times of several months. That advance notice saves lives and money when it’s used well.
Preparation looks different across contexts. For agricultural systems, it means adjusting planting calendars, selecting drought or flood-tolerant varieties, and pre-positioning credit or insurance instruments. For water managers, it means revising reservoir operating rules to capture expected precipitation or stretch limited supplies. For public health officials, it means anticipating disease outbreaks that follow El Niño’s hydrological disruptions.
Technology plays an expanding role. Sustainable technology applications in early warning systems, from satellite-based soil moisture monitoring to AI-enhanced seasonal forecasting, are narrowing the gap between forecast and action. But technology alone doesn’t build resilience; institutions, financing, and political attention do. The countries that weather El Niño best tend to be those with robust meteorological services, clear emergency protocols, and social safety nets that can scale quickly.
There’s also the question of how El Niño interacts with other climate patterns. The Indian Ocean Dipole, the Atlantic Multidecadal Oscillation, and the Southern Annular Mode all modulate what any single El Niño produces. This year, a positive Indian Ocean Dipole is co-developing, which typically reinforces dry conditions over Indonesia and Australia while enhancing rainfall over East Africa. The combination isn’t unprecedented, but it’s consequential.
Frequently Asked Questions
Understanding This El Niño Event
How does this El Niño compare to the strongest El Niño on record?
The 1997-98 and 2015-16 events remain the benchmark for intensity in the modern observational record, with peak Niño 3.4 anomalies approaching or exceeding 2.5°C. As of late summer 2023, this event has crossed the 1.5°C threshold and is tracking toward the 2.0°C range. Whether it matches or exceeds those historical peaks won’t be clear until the November-January period. What’s already unusual is the speed of development; few events have intensified this rapidly from neutral conditions.
What are the main El Niño climate effects expected this winter?
The typical El Niño climate effects include:
- Wetter than average conditions across the southern United States, from California to the Gulf Coast
- Drier, warmer conditions in the Pacific Northwest and northern tier states
- Suppressed rainfall and elevated fire risk across Indonesia, Malaysia, and northern Australia
- Weakened Indian monsoon performance, though with substantial year-to-year variability
- Enhanced rainfall during East Africa’s short rains season (October-December)
- Altered tropical cyclone patterns, with suppressed Atlantic hurricane activity but potentially enhanced eastern Pacific activity
Is climate change making El Niño stronger or more frequent?
The science here is still evolving, and the honest answer is nuanced. We don’t yet have clear evidence that global warming is increasing El Niño frequency. That said, the IPCC AR6 did assess with medium confidence that strong El Niño and La Niña events have become more frequent since 1950 compared to 1850-1950, a trend that may continue as warming progresses.
What we know more solidly is this: higher baseline temperatures amplify El Niño’s impacts. The same atmospheric circulation anomaly produces bigger extremes when the oceans and atmosphere start from a warmer state. The event itself may not be more common, but its consequences hit harder.
Impacts and Preparedness
Which regions face the greatest risks from this rapidly developing event?
Vulnerability is a function of both exposure and adaptive capacity. Regions facing acute risk include:
- Maritime Southeast Asia, where fire and haze crises can develop quickly with suppressed rainfall
- The Horn of Africa, where enhanced rains on drought-degraded landscapes produce dangerous flooding
- Southern Africa, where El Niño typically correlates with poor rainy seasons and agricultural stress
- The central and southern United States, where heavy winter precipitation can produce both beneficial drought relief and destructive flooding
- Pacific Island nations, where sea level anomalies and altered tropical cyclone tracks threaten low-lying communities
Many rapidly developing countries in these regions have seen economic growth that could support adaptation, but infrastructure and institutional capacity haven’t kept pace with increasing climate exposure.
What can communities do to prepare?
Effective preparation spans time scales. Immediate steps include monitoring seasonal forecasts, reviewing emergency protocols, and pre-positioning supplies. Medium-term measures involve adjusting agricultural practices, improving drainage infrastructure, and strengthening early warning systems. Longer-term, communities benefit from diversifying water sources, restoring natural buffers like wetlands and forests, and building social protection programs that can scale during crises.
For urban areas experiencing rapid growth, land use planning deserves particular attention. Innovative approaches to urban food production can reduce dependence on climate-vulnerable rural supply chains. The expansion of impervious surfaces in poorly planned suburbs amplifies flood risk precisely where population is concentrating.
How long will this El Niño last?
Most El Niño events persist for 9-12 months, peaking in Northern Hemisphere winter and decaying through spring. A typical timeline would see this event weakening by March-May 2024, with neutral conditions returning by mid-2024. There’s a possibility of a quick transition to La Niña, as occurred after the 2015-16 super El Niño, but this isn’t guaranteed and forecast confidence for the second half of 2024 remains limited.
Sources
- Intergovernmental Panel on Climate Change, 2021. Climate Change 2021: The Physical Science Basis. Contribution of Working Group I to the Sixth Assessment Report. Cambridge University Press. https://www.ipcc.ch/report/ar6/wg1/
- National Oceanic and Atmospheric Administration, Climate Prediction Center, 2023. El Niño/Southern Oscillation (ENSO) Diagnostic Discussion, September 2023. https://www.cpc.ncep.noaa.gov/products/analysis_monitoring/enso_advisory/ensodisc.shtml
- World Meteorological Organization, 2023. WMO Declares Onset of El Niño Conditions, July 2023. https://wmo.int/news/media-centre/wmo-declares-onset-el-ni%C3%B1o-conditions
- Australian Government, Bureau of Meteorology, 2023. ENSO Outlook and El Niño Watches, updated August 2023. http://www.bom.gov.au/climate/enso/
- National Oceanic and Atmospheric Administration, 2023. Climate Prediction Center: ENSO Temperature Anomalies and Historical Rankings. https://www.cpc.ncep.noaa.gov/data/indices/sstoi.indices
- Field, R.D. et al., 2016. Indonesian fire activity and smoke pollution in 2015 show persistent nonlinear sensitivity to El Niño-induced drought. PNAS, 113(33), 9204-9209. https://doi.org/10.1073/pnas.1524888113

Dr. Alexander Tabibi is an entrepreneur, investor, and advocate for sustainable innovation with a deep commitment to leveraging technology for environmental and social good. As a thought leader at the intersection of business and sustainability, Dr. Tabibi brings a strategic vision to Green.org, helping guide its mission to inspire global climate awareness and actionable change.
With a background in both medicine and business, Dr. Tabibi combines analytical rigor with entrepreneurial insight.