
Greenland ice sheet shrinks for 30th year in a row
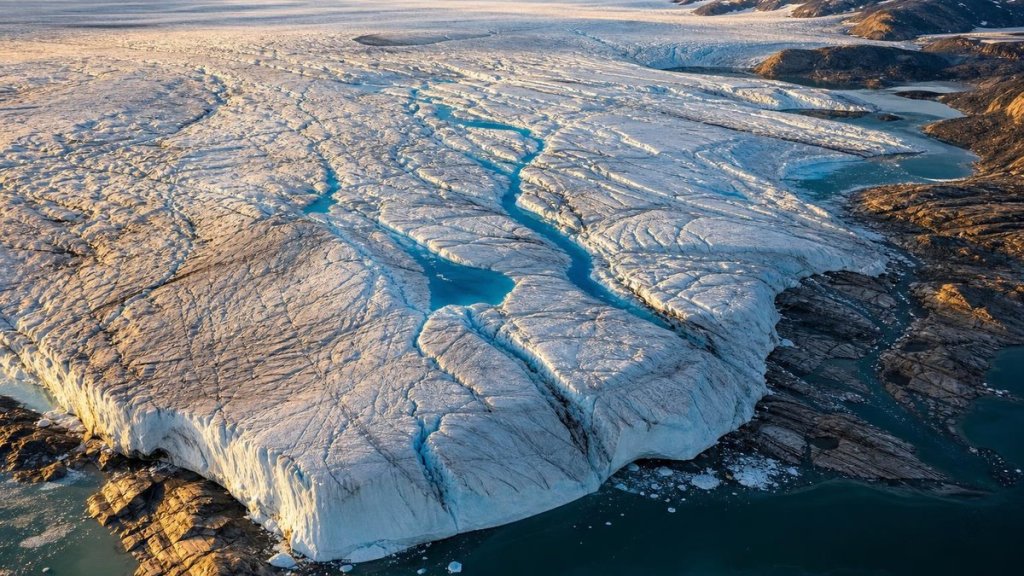
Some years grab headlines with record heat and dramatic satellite images of the greenland ice sheet bleeding meltwater across the landscape. Then there are years like 2025-26, when summer arrived late, clouds lingered longer than usual, and the surface melt seemed almost subdued. Yet Greenland still lost ice. Again. For the 30th consecutive year.
This is the story climate scientists at the Danish Meteorological Institute (DMI) have been tracking. Dr Martin Stendel and Prof Ruth Mottram published their annual analysis through Carbon Brief in late October 2026. Their finding is stark: even a comparatively “quiet” year on the ice sheet still ended with roughly 135 billion tonnes of net ice loss. When they layered in satellite data, weather station readings, GPS measurements and aerial observations, that estimate climbed to 173 billion tonnes.
Thirty years is not an arbitrary number in climate science. It is the standard period researchers use to distinguish genuine climate trends from natural weather noise. Greenland has now crossed that threshold. Every single year since 1996 has finished with more ice lost than gained, regardless of whether the summer was scorching or cool.
How scientists read the ice sheet’s vital signs
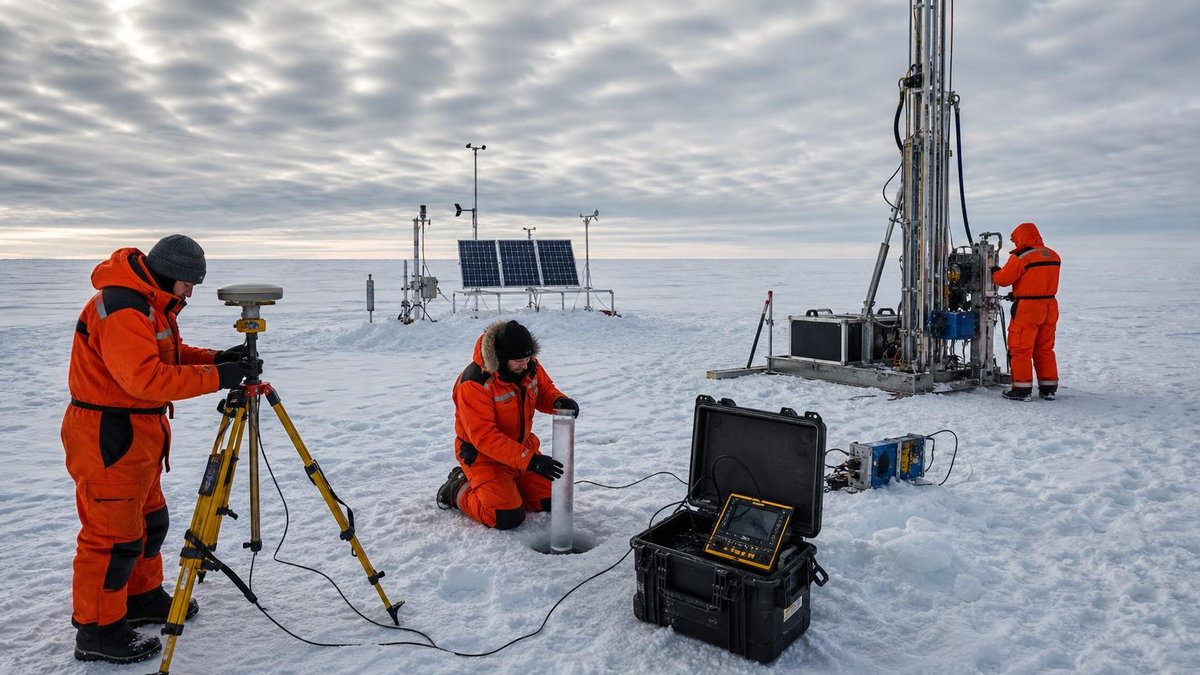
Researchers monitor Greenland through two main lenses. The first is surface mass balance, the simple accounting of what accumulates versus what melts at the surface. Snowfall brings mass in; warm weather sends it out as runoff. The second, more comprehensive measure is total mass balance. This folds in everything: surface melt, iceberg calving, the melting where glacier fronts meet seawater, and even the slow thaw happening beneath the ice itself.
The 2025-26 ice year illustrates why both measures matter. Surface mass balance actually looked healthy, finishing at 519 billion tonnes, the sixth highest in 46 years of records. A greenland ice sheet map from Polar Portal shows this clearly: broad blue patches indicating above-average snow accumulation, particularly on the west coast north of Nuussuaq.
But surface numbers can deceive. Once marine losses and basal melt entered the equation, the picture flipped. The ice sheet bled mass overall. This pattern, where decent snowfall cannot compensate for ice sliding into the ocean and melting at the margins, has become the new normal.
A cool summer that still couldn’t save the ice
The 2025-26 melt season began oddly. Winter and early spring were unusually dry across southern Greenland, depositing about 40 billion tonnes less snow than typical. Dry winters usually spell trouble; that missing snowpack normally acts as a reflective shield, delaying summer melt.
Yet June arrived cool and cloudy. The official melt onset did not begin until 5 June, nine days later than the long-term average. From a greenland ice sheet aerial view, the surface would have appeared surprisingly bright and intact for the time of year.
Everything shifted in late June. Warm, sunny conditions took hold through July. On 22 July, melting engulfed 74.9% of the ice sheet. That is a massive area, though it fell short of the record 81.2% set in July 2025. The early June snowpack had bought Greenland some time. Much of the July meltwater percolated into underlying snow and refroze rather than running off.
Still, the season’s moderation only goes so far. The real story lies in what happened at the edges.
The Petermann glacier breaks apart
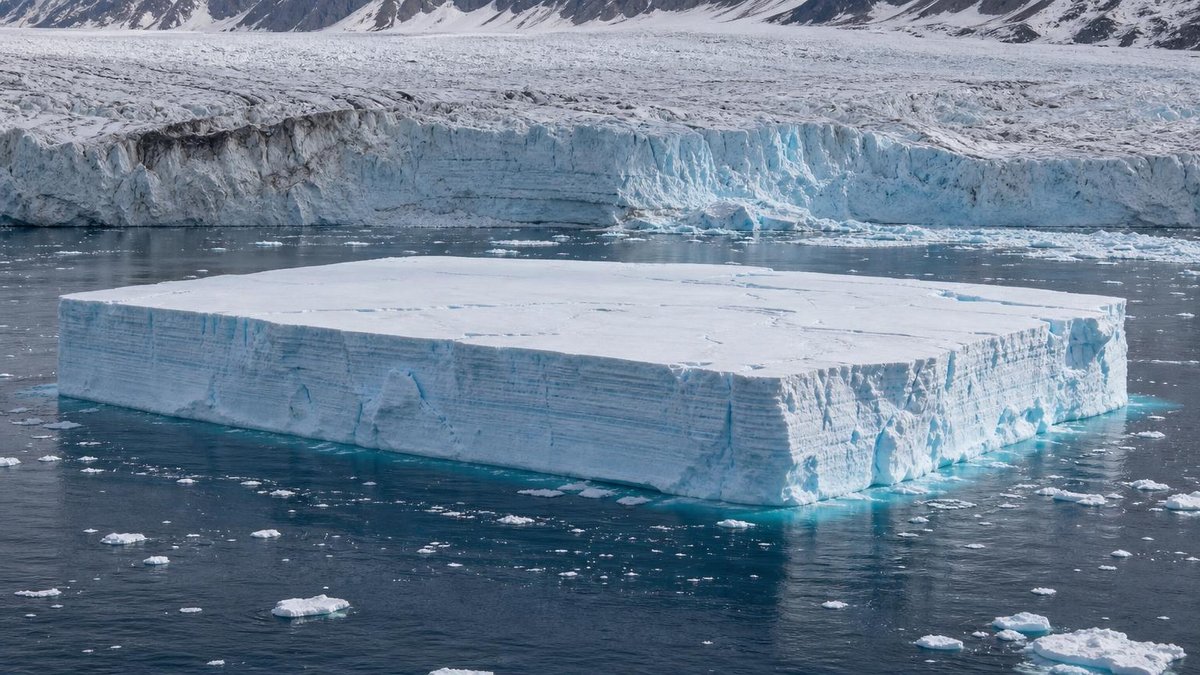
On 4 August 2026, one of Greenland’s most watched glaciers delivered a spectacular reminder that ice loss does not need extreme heat. A vast tabular iceberg calved from the floating ice tongue of Petermann glacier in northwest Greenland.
The berg covered more than 76 square kilometres, with an estimated thickness of 150 metres. The frozen water it contained could submerge greater London to a depth of 6.65 metres. It was the largest loss of floating ice at Petermann since 2012, and the biggest calving event by any Arctic glacier since 2020.
Scientists had anticipated this. Rifts had been cutting across the ice tongue for years. Similar breakoffs occurred in 2010 and 2012. Two more ice islands, roughly 94 and 84 square kilometres respectively, are expected to detach as existing cracks widen.
Because this ice was already floating, the calving does not directly raise sea levels. But Petermann’s ice tongue acts as a brake, slowing the flow of interior ice toward the ocean. Remove that brake, and the conveyor belt accelerates. To date, calving and glacier retreat have driven roughly two-thirds of Greenland’s total ice loss.
The global weather connection
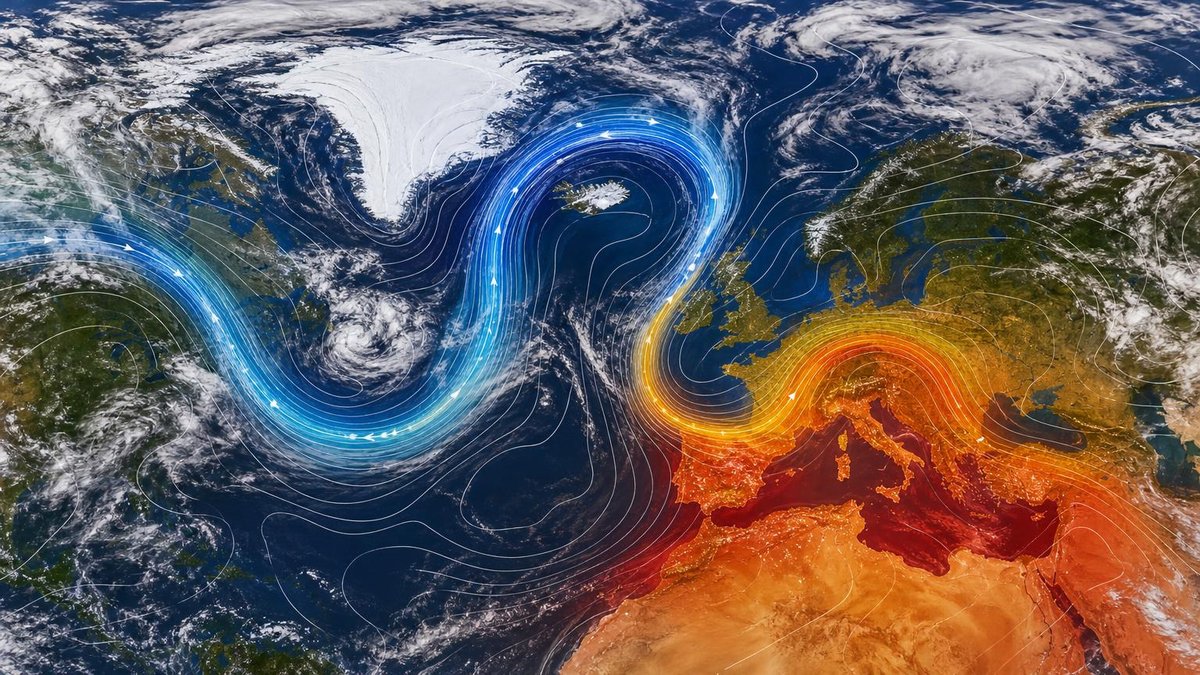
Greenland’s relatively benign summer had an unlikely source: the misery unfolding across Europe. Multiple heatwaves scorched southern Europe and North America during summer 2026, setting temperature records in numerous countries.
These extremes were linked to a blocked jet stream pattern shaped like the Greek letter Omega. High-pressure systems parked over the heated regions, while cooler, wetter conditions settled at the pattern’s flanks. Greenland happened to sit on the right side of this Omega block, catching the cool, cloudy weather that suppressed melt.
The contingency is unsettling. Shift that Omega pattern by half a wavelength, and Greenland would have likely roasted. Record melt would have followed, and the 30-year streak of losses would have deepened further. The greenland ice sheet melting we avoided in 2026 offers no comfort; it merely postpones the inevitable under continued warming.
What three decades of loss actually means
Individual years can fool us. A blazing summer like 2012, when Greenland shed approximately 458 billion tonnes of ice, screams crisis. A cooler year like 2025-26, with “only” 135-173 billion tonnes lost, whispers instead. But the whisper has persisted for three decades without interruption.
This matters because 30 years is climatology’s gold standard for separating signal from noise. Natural climate variations operate on shorter timescales. When a trend holds steady across three full decades, scientists can attribute it to underlying forcing rather than random fluctuation. Greenland’s unbroken losing streak now meets that standard. The fingerprint of human-caused climate change is no longer debated in this context; it is measured.
The past two years have been moderate by recent standards. Both still produced losses exceeding 100 billion tonnes annually. There are no “good” years anymore, only less catastrophic ones.
Greenland’s role in rising seas

The Ice Sheet Mass Balance Intercomparison Exercise (IMBIE) brings together 42 independent estimates from satellite gravimetry, altimetry and other methods into a single authoritative record. Their September 2026 assessment, published in Scientific Data, frames Greenland’s losses within the global picture.
Between 1979 and 2023, Greenland and Antarctica together lost 11,309 billion tonnes of ice, raising global sea levels by approximately 32 millimetres. The two ice sheets now account for nearly one-quarter of observed sea level rise.
Greenland dominates this contribution. From 1972 to 2023, it lost 6,215 billion tonnes, averaging 119 billion tonnes annually. Two-thirds came from increased ice discharge, primarily calving and glacier retreat. One-third stemmed from reduced surface mass balance. Annual losses accelerated dramatically, from roughly 60 billion tonnes in the 1980s to 264 billion tonnes in the 2010s.
Antarctica’s losses, while smaller to date at 4,780 billion tonnes and 13 millimetres of sea level rise, carry ominous potential. Its ice sheet is roughly ten times larger than Greenland’s. All Antarctic losses so far come from ice discharge, concentrated in West Antarctica.
The processes now emerging in Antarctica, increasing surface melt, shrinking sea ice, retreating ice shelves and seasonal outlet glacier retreat, mirror what Greenland has experienced for decades. Researchers call this the “Greenlandification” of Antarctica. The smaller ice sheet has become both the largest current source of ice-driven sea level rise and a preview of what the larger one may deliver.
For readers tracking Arctic sea ice trends and their broader implications, Greenland’s trajectory is inseparable from that story. The Arctic crisis unfolding at the top of the world finds its most concrete expression in these measured tonnes of disappearing ice.
Those interested in how technology might eventually help monitor such losses can explore emerging approaches like ice robots designed for polar environments, though current capabilities remain far from reversing trends at this scale.
Comparing ice sheet contributions to sea level rise
The IMBIE assessment provides clear figures for comparing how Greenland and Antarctica contribute to global sea level rise. The table below summarizes the key metrics from the 1972-2023 and 1979-2023 analysis periods.
| Metric | Greenland | Antarctica |
|---|---|---|
| Total ice loss (period) | 6,215bn tonnes (1972-2023) | 4,780bn tonnes (1972-2023) |
| Sea level contribution | Roughly 19mm | Roughly 13mm |
| Primary loss mechanism | Two-thirds discharge, one-third surface melt | Entirely ice discharge (West Antarctica) |
| 1980s annual average | ~60bn tonnes/year | Not separately quantified |
| 2010s annual average | ~264bn tonnes/year | Not separately quantified |
| Relative ice sheet size | Smaller | Roughly 10x larger |
Source: IMBIE, Scientific Data, September 2026; DMI Polar Portal analysis.
Frequently asked questions
Understanding Greenland’s ice loss
What is the difference between surface mass balance and total mass balance?
Surface mass balance measures only what happens at the top of the ice: snowfall gains minus melt losses. Total mass balance includes everything, surface processes plus icebergs calving into the ocean, melting where glaciers meet seawater, and melt from the ice sheet’s underside. Greenland’s surface mass balance is usually positive, but its total mass balance has been negative every year since 1996.
Why does 30 consecutive years of ice loss matter scientifically?
Climate scientists use 30-year periods to distinguish genuine climate trends from natural variability. Weather fluctuates year to year, but three decades of consistent directional change indicates an underlying shift. Greenland’s unbroken 30-year losing streak means researchers can now confidently attribute this mass loss to human-caused climate change rather than natural cycles.
How does a cool summer still result in ice loss?
Even in cooler years, baseline processes continue. Icebergs still calve. Glaciers still flow toward the ocean. Marine-terminating glaciers still melt where they meet warmer seawater. In 2025-26, the Petermann glacier calved a 76 square kilometre ice island. These marginal processes, combined with some surface melt, overwhelmed the season’s decent snowfall accumulation.
Global implications and future outlook
What would happen if Greenland’s ice sheet melted completely?
Scientists do not project complete melting in the coming centuries, but the question illustrates the scale. The greenland ice sheet contains enough ice to raise global sea levels by approximately 7 metres. Current losses contribute measurably to observed sea level rise, with acceleration evident since the 1980s.
How does Greenland compare to Antarctica as a sea level threat?
Currently, Greenland contributes more to sea level rise. However, Antarctica’s ice sheet is roughly ten times larger. The processes now seen in Antarctica, surface melt, ice shelf collapse, outlet glacier retreat, were first observed in Greenland decades ago. If Antarctica follows Greenland’s path at scale, the consequences for coastal communities would be far more severe.
What is “Greenlandification” of Antarctica?
Researchers use this term to describe how Antarctic ice dynamics are increasingly resembling Greenland’s. This includes more surface melting, shrinking sea ice, deteriorating ice shelves, and seasonal retreat of outlet glaciers. Greenland serves as a real-world demonstration of how a major ice sheet responds to sustained warming, offering insights into Antarctica’s possible future.
Can individual years of high snowfall reverse Greenland’s trend?
Individual snowy years can improve the surface mass balance temporarily, as seen in 2025-26 with its sixth-highest surface mass balance in 46 years. However, one good snow season cannot compensate for the structural losses from calving, marine melt, and the long-term decline in surface mass balance. The total mass balance has remained negative regardless of surface variability.
Sources
- Stendel, M. and Mottram, R., 2026. “Guest post: Greenland ice sheet shrinks for 30th year in a row.” Carbon Brief. Published 27 October 2026. https://www.carbonbrief.org/guest-post-greenland-ice-sheet-shrinks-for-30th-year-in-a-row
- IMBIE Team, 2026. “Ice Sheet Mass Balance Intercomparison Exercise (IMBIE).” Scientific Data, September 2026. https://www.nature.com/articles/s41597-022-01361-5 [VERIFY exact 2026 URL]
- Polar Portal, 2026. Greenland surface mass balance data and maps, 2025-26 ice year. Danish Meteorological Institute, GEUS, and DTU Space. https://polarportal.dk/en/groenland/maalinger/greenland-ice-sheet-surface-mass-budget/
- ESA/Copernicus Sentinel-1, 2026. Petermann glacier calving sequence, August 2026. https://scihub.copernicus.eu/ [VERIFY specific image URL]
This article is for informational purposes only.
Reference: https://www.carbonbrief.org/guest-post-greenland-ice-sheet-shrinks-for-30th-year-in-a-row

Dr. Alexander Tabibi is an entrepreneur, investor, and advocate for sustainable innovation with a deep commitment to leveraging technology for environmental and social good. As a thought leader at the intersection of business and sustainability, Dr. Tabibi brings a strategic vision to Green.org, helping guide its mission to inspire global climate awareness and actionable change.
With a background in both medicine and business, Dr. Tabibi combines analytical rigor with entrepreneurial insight.