

Somewhere between the daily flood of headlines about politics, inflation, and the latest tech drama, the world quietly crossed one of the most significant energy milestones in human history. Global installed solar capacity has now surpassed 3 terawatts. Three trillion watts of peak generating power, sitting on rooftops, floating on reservoirs, and stretching across desert fields from China to Chile. And most people have absolutely no idea it happened.
That silence is strange, because the number itself is extraordinary. To put it in terms that actually land: 1 terawatt is roughly enough to meet the entire peak electricity demand of the United States. We now have three of those. And the pace at which we got here tells an even bigger story than the milestone itself.
From 70 Years to 2: How Solar’s Growth Curve Changed Everything
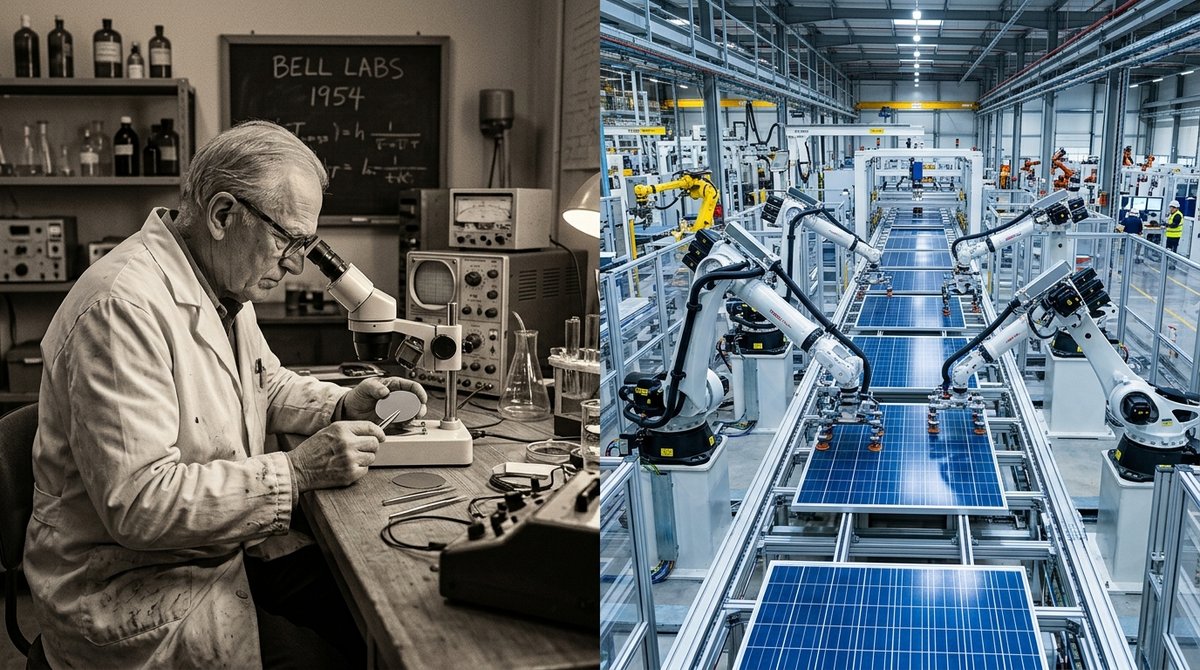
The silicon solar cell was invented in 1954. For nearly seven decades after that, the technology existed, improved, and gradually spread, but reaching the first terawatt of global installed capacity still took until 2022. That first terawatt was painstaking, expensive, and built largely on government subsidies in wealthy nations willing to absorb the upfront cost.
The second terawatt arrived in 2024, less than three years later. The third terawatt followed in early 2026, according to Bloomberg, crossing the line in under two years. The timeline is compressing at a rate that makes traditional energy forecasting look almost comically conservative.
Analysts are actually debating the exact date the 3 terawatt threshold was crossed, not because the data is unclear, but because solar is being installed so fast that tracking databases can’t keep up in real time. We’re adding roughly a gigawatt of new solar capacity every twelve hours. Every half day, somewhere on the planet, another gigawatt goes up.
This is exactly the kind of exponential curve that forecasters predicted more than a decade ago and were widely mocked for. Traditional energy agencies underestimated solar growth almost every single year. The exponential model, dismissed as optimistic fantasy at the time, has turned out to be closer to reality than any of the conservative projections.
The 2025 Numbers Are Genuinely Staggering
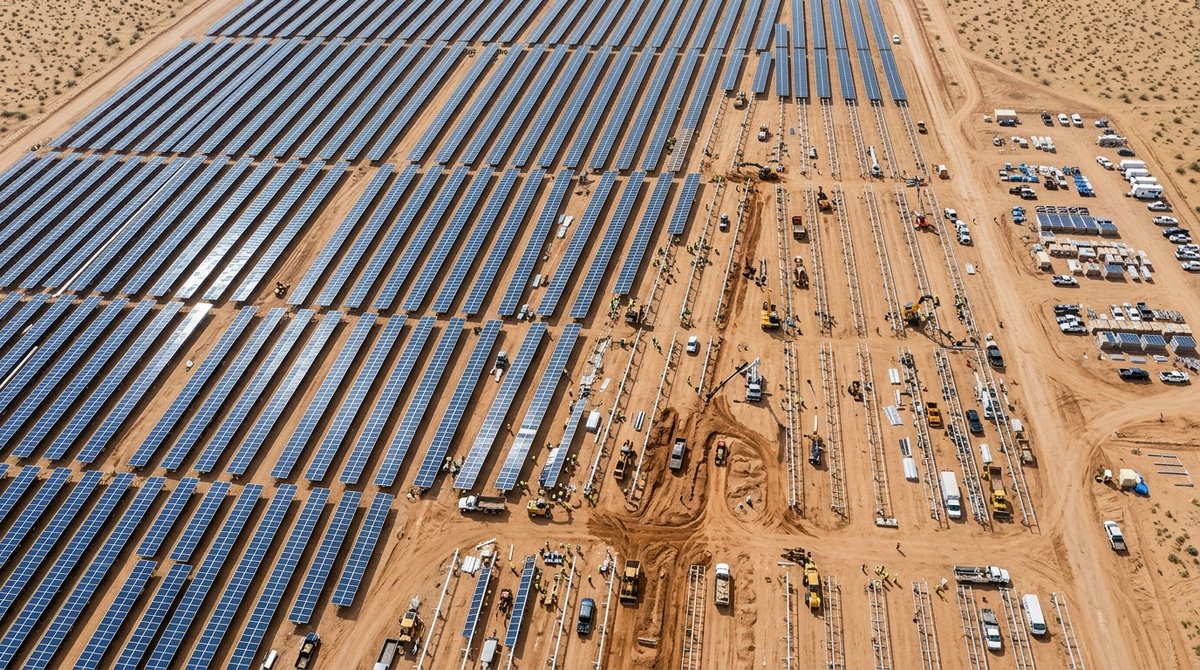
If the 3 terawatt milestone is the headline, the 2025 installation figures are the story underneath it. In a single year, the world installed approximately 700 gigawatts of new solar. That’s more capacity than the entire planet had cumulatively built through the end of 2020.
Solar accounted for 77% of all new renewable capacity additions globally in 2025, per the IEA’s photovoltaic program. Wind, once considered the dominant renewable technology, came in at just 17%. And 2025 marked the first year solar generated more electricity than wind worldwide: roughly 2.78 petawatt-hours versus wind’s 2.71.
Solar’s share of global electricity has nearly tripled since 2020, from roughly 3% to around 9%. That shift connects to a broader pattern a major 2024 milestone report documented, with clean energy now powering 40% of global electricity. A decade ago, that figure would have sounded like wishful thinking.
China, India, and the New Geography of Solar Power
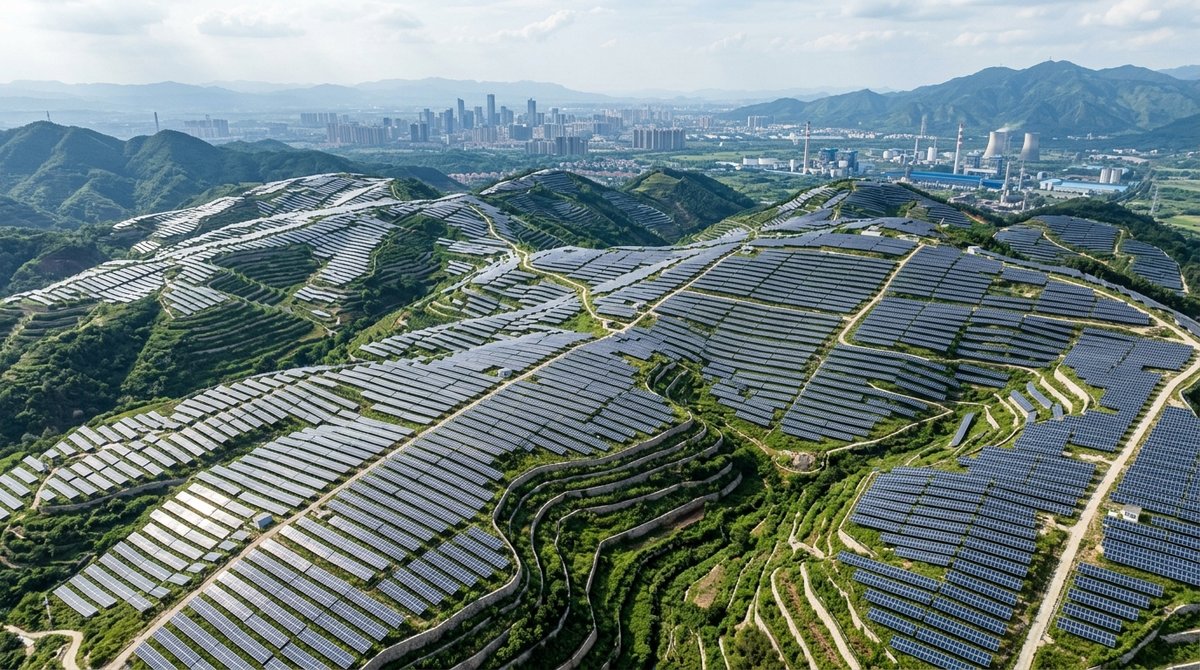
Nobody drives this story more than China, and the gap between China and everyone else is enormous. China accounted for roughly 60% of all new solar installed in 2025, around 415 gigawatts added in a single year. Cumulative installed capacity now sits at approximately 1.37 terawatts. That’s more than the United States, India, Germany, and Japan combined, and about five times the US total of 266 gigawatts.
The story of China’s solar dominance is one of manufacturing scale and long-term industrial strategy. China’s ambitions in solar and wind extend well beyond current capacity, with continued expansion built into national energy planning for the coming decades.
But the country to watch closely right now is India. India sits third globally with 166 gigawatts of installed capacity and installed nearly 46 gigawatts in 2025 alone, representing growth of more than 145% year over year. Analysts increasingly view India as the second major engine of global solar expansion, with massive untapped potential across both utility-scale projects and distributed rooftop systems.
There’s also a wider picture that official statistics miss entirely. Millions of solar installations across Africa, Pakistan, Nigeria, the Philippines, and elsewhere exist completely off-grid and largely uncounted in global databases. The real installed base of solar capacity worldwide is almost certainly higher than the numbers suggest.
Why Developing Nations Are Going Solar (It’s Not About Climate Policy)

Here’s the part that disrupts a lot of assumptions. The solar boom spreading through the developing world isn’t primarily driven by climate commitments or green policy frameworks. It’s driven by pure economics.
For countries spending enormous portions of their GDP on fossil fuel imports and dealing with grids that are either chronically unreliable or nonexistent, cheap solar panels from China represent the fastest and most affordable path to stable electricity. When the alternative is expensive imported diesel running a generator that breaks down constantly, a rooftop solar array and a battery make obvious financial sense.
The first terawatt of global solar was built by wealthy nations subsidizing the technology to bring costs down. Those subsidies worked. The second and third terawatts are increasingly being built by countries that simply can’t afford not to go solar. BloombergNEF projects the world will reach 9 terawatts of installed solar by 2036, and by that point, developing nations outside China are expected to hold more cumulative solar capacity than the wealthy countries that started the whole thing.
How wind, solar, and storage are replacing coal worldwide is reshaping energy systems at every level, faster than most analysts predicted even five years ago.
Challenges at the Frontier: Curtailment, Negative Prices, and the Battery Imperative
Success at this scale creates its own set of problems. In China, generation capacity has outrun both transmission infrastructure and storage, so grid operators are forced to curtail solar output rather than waste it. Australia and California regularly see negative daytime electricity prices because solar is flooding the grid faster than demand can consume it.
These aren’t signs that solar has failed. They’re signs that solar has succeeded faster than the surrounding infrastructure could keep up. The solution is well understood: storage. Battery systems that absorb midday solar surpluses and release them in the evening hours when demand peaks.
China doubled its grid-scale battery storage capacity in a single year. The storage curve is now following the same exponential trajectory that solar panels followed a decade ago. Australia leads the world in solar per capita at 1.73 kilowatts per person, ahead of the Netherlands and Germany, both of which installed massive capacity despite receiving significantly less sunlight. If a country with relatively modest solar resources can build that much capacity, the argument that solar only works in sunny places evaporates completely.
Frequently Asked Questions About the 3 Terawatt Solar Milestone
What does 3 terawatts of solar actually mean?
Three terawatts is the combined peak generating capacity of every solar panel installed worldwide. For scale: one terawatt roughly matches the peak electricity demand of the entire United States. Actual output shifts constantly with sunlight conditions, but the potential sitting on rooftops and in solar fields is now three times that benchmark.
How fast did we reach 3 terawatts of solar?
- The first terawatt took nearly 70 years, finally crossed in 2022.
- The second terawatt arrived in under three years, in 2024.
- The third terawatt was crossed in early 2026, in under two years.
- The world is currently adding approximately one gigawatt of new solar every twelve hours.
Which countries lead in solar capacity?
- China leads decisively with roughly 1.37 terawatts of installed capacity.
- The United States is second with approximately 266 gigawatts.
- India is third at around 166 gigawatts, growing at a striking pace.
- Australia leads globally in solar capacity per person at 1.73 kilowatts per capita.
Why are developing countries installing so much solar?
Economics, not climate policy, is the primary driver. Solar is now the cheapest electricity source available to most of the world. For nations with unreliable grids or no grid access at all, a solar array sidesteps expensive fossil fuel imports entirely. The math is straightforward.
What is the biggest challenge facing solar growth right now?
Storage and transmission. Solar produces power during daylight; demand peaks after sunset. Without sufficient battery storage or grid infrastructure to move that power around, solar output gets curtailed or pushes electricity prices negative during peak generation hours.
How much solar capacity will the world have by 2036?
BloombergNEF projects global installed solar capacity will reach approximately 9 terawatts by 2036, with developing nations outside China expected to hold more cumulative capacity than wealthy nations by that point.
Is solar now bigger than wind power globally?
Yes. In 2025, solar generated more electricity than wind for the first time, producing approximately 2.78 petawatt-hours compared to wind’s 2.71. Solar also represented 77% of all new renewable capacity additions globally, compared to wind’s 17%.
The 3 terawatt milestone deserved far more attention than it got. It marks the moment when solar stopped being a promising niche technology and became, without question, the dominant force reshaping how the world generates electricity. The curve isn’t flattening. It’s steepening. And the next chapter, driven by batteries, grid expansion, and billions of people in the developing world who simply need affordable power, is going to be even more remarkable than the one we just finished writing.
Sources
- Bloomberg: Global solar capacity crosses 3 terawatt threshold, early 2026
- IEA Photovoltaic Power Systems Programme: 2025 global solar capacity additions
- BloombergNEF: Global solar capacity projections to 2036
- IEA: Renewable capacity data, 2024 and 2025
- Electric Viking: Solar and battery storage analysis, 2025 and 2026
This article is for informational purposes only.
Reference: https://www.youtube.com/watch?v=ELohiH3JI1k

Dr. Alexander Tabibi is an entrepreneur, investor, and advocate for sustainable innovation with a deep commitment to leveraging technology for environmental and social good. As a thought leader at the intersection of business and sustainability, Dr. Tabibi brings a strategic vision to Green.org, helping guide its mission to inspire global climate awareness and actionable change.
With a background in both medicine and business, Dr. Tabibi combines analytical rigor with entrepreneurial insight.