


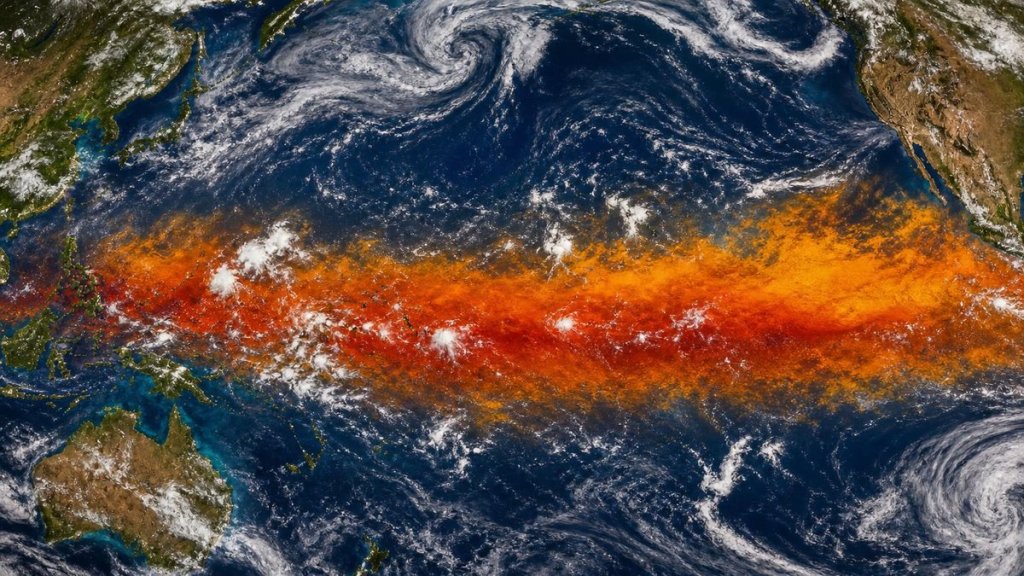
Every few years, a band of unusually warm water stretches across the tropical Pacific. The atmosphere notices immediately.
Farmers in Australia pray for rain that never arrives. Peruvian fishermen watch their catch disappear.
California braces for storms that send mudslides through fire-scarred hillsides.
This is El Niño. Its fingerprints turn up on weather maps from Nairobi to New Delhi.
Scientists have tracked these events since the 1950s. The global connections only came into focus recently. The 2023-24 El Niño, one of the five strongest on record, showed how a single oceanic anomaly can reroute jet streams, rewrite rainfall patterns, and strain food systems thousands of miles away. Understanding these teleconnections matters more than ever, because El Niño weather effects worldwide are intensifying alongside background global warming.
How a Warm Pool in the Pacific Reorganizes Global Circulation

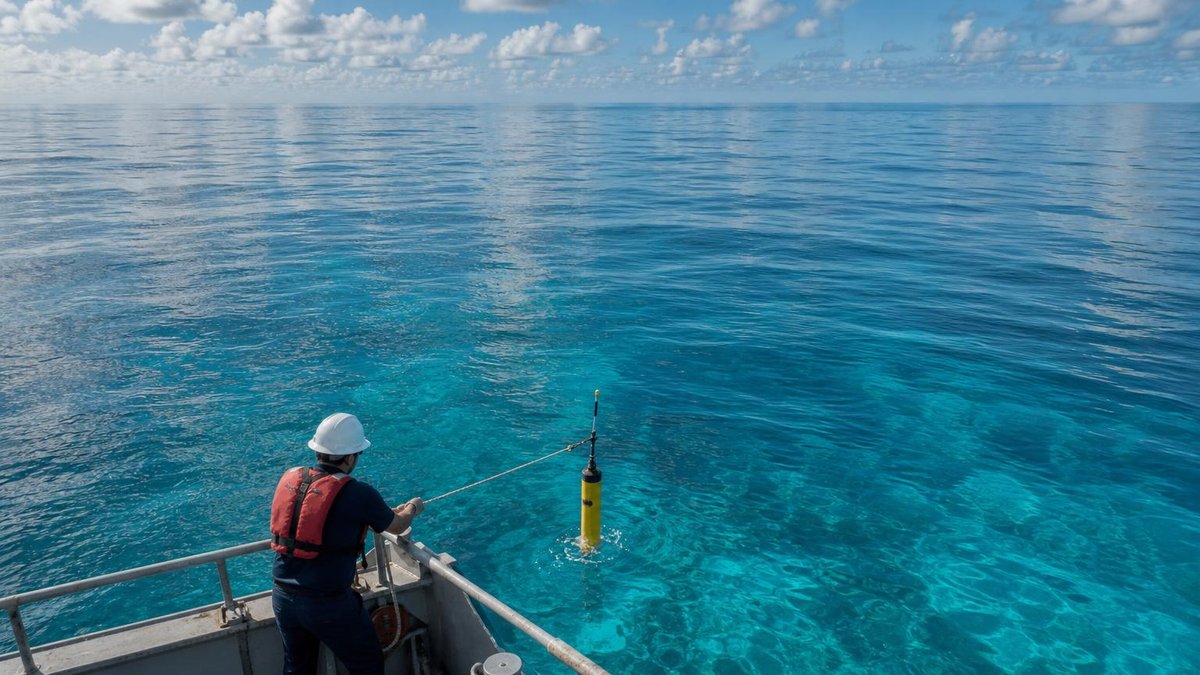
El Niño starts small. Trade winds, those steady west-blowing breezes across the Pacific, slacken. Without their push, warm surface water drifts back eastward.
In the Niño 3.4 region, the monitoring zone between 5°N-5°S and 170°-120°W, sea surface temperature anomalies typically exceed 0.5°C above average for five consecutive three-month periods before meteorologists make it official.
That modest warming sets off atmospheric ripples. The Walker circulation, the vast loop of air rising over Indonesia and sinking off South America, weakens. Sometimes it reverses entirely.
Rossby waves, those planetary-scale undulations in the jet stream, carry El Niño’s influence poleward and eastward. A regional sea-surface shift becomes a global rearrangement of where rain falls, where droughts deepen, and where storms track.
The Intergovernmental Panel on Climate Change notes that El Niño-Southern Oscillation (ENSO) remains the dominant source of year-to-year climate variability worldwide, even as human-caused warming alters the baseline. The 2021 IPCC Sixth Assessment Report found with medium confidence that the amplitude of El Niño sea surface temperature variability may increase with continued warming, though natural variability still obscures the trend.
Five Ways El Niño is Affecting the Weather Around the World
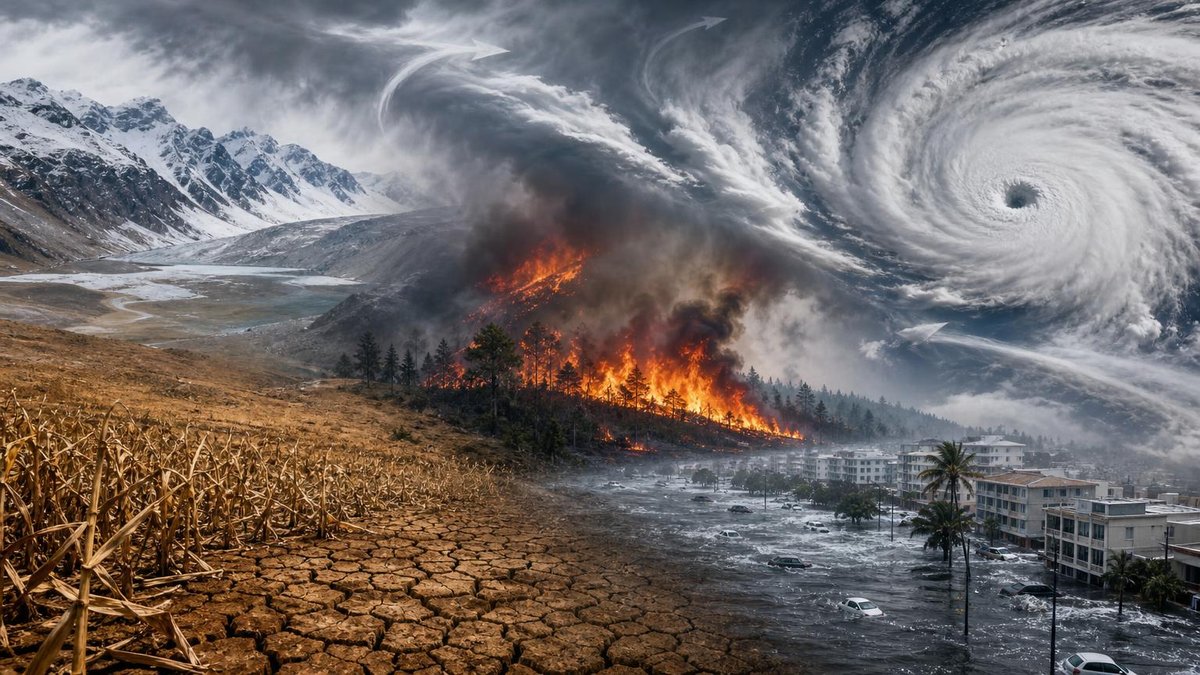
While philosophers have long sought to understand causation in nature, including through frameworks like thomas aquinas five ways of demonstrating the existence of first causes, modern climate science traces El Niño’s impacts through observable physical mechanisms. Here are the five most significant pathways.
Intensified Drought Across Eastern Australia and Southeast Asia
El Niño shoves the warm pool eastward. The atmospheric ascent that normally drenches Indonesia and northern Australia moves with it. Rainfall collapses across a vast arc from Sumatra to Queensland.
The Australian Bureau of Meteorology documented that the 2015-16 El Niño brought the third-driest winter-spring period on record to eastern Australia, contributing to severe bushfire conditions the following summer. The 1997-98 event, the strongest of the 20th century, reduced wet-season rainfall across Papua New Guinea by 50-80% in some locations, triggering food shortages and wildfires that released massive carbon stores from peatlands.
In Southeast Asia, the shift disrupts the monsoon circulation that agriculture depends upon. Rice production in Thailand, Vietnam, and the Philippines typically drops during El Niño years, with economic losses cascading through global commodity markets.
Amplified Flooding Along the Pacific Coast of the Americas
The same warm water that leaves Australia parched delivers moisture to the Americas with remarkable efficiency. Peru and Ecuador, where coastal waters normally stay cold and arid, experience dramatic rainfall increases. The 1982-83 and 1997-98 events both produced rainfall totals several times the annual average in coastal desert regions, triggering landslides and infrastructure destruction.
North America feels the downstream effects through a strengthened subtropical jet stream. California, in particular, faces a familiar pattern: El Niño winters bring atmospheric river events that can deliver half the state’s annual precipitation in a handful of storms. The relationship isn’t deterministic; strong El Niños favor wet California winters, but other factors, including the phase of the Pacific Decadal Oscillation, modulate the outcome.
Disrupted Indian Monsoon Patterns
The Indian summer monsoon, which delivers 70-80% of annual rainfall to a population exceeding one billion, shows a statistically significant negative correlation with El Niño. The mechanism involves an eastward shift in the Walker circulation that suppresses ascent over the Indian subcontinent.
India’s meteorological department classifies about 40% of El Niño years as associated with below-normal monsoon rainfall. The 2009 event contributed to the worst monsoon deficit since 1972, reducing agricultural output and forcing India to import sugar for the first time in years. The human cost falls disproportionately on smallholder farmers without irrigation access, pushing millions toward nutritional insecurity during deficient years.
Altered Tropical Cyclone Activity Across Ocean Basins
El Niño redistributes tropical cyclone energy rather than simply increasing or decreasing it globally. The western North Pacific typically sees more intense typhoons forming farther east, with some tracks shifting toward the central Pacific. Hawaii, rarely threatened historically, faced multiple hurricane watches during the 2015-16 event.
The Atlantic basin generally experiences suppressed hurricane activity during El Niño summers, as increased wind shear tears developing storms apart. The eastern Pacific, conversely, often sees enhanced activity. Mexico’s Pacific coast faces elevated landfall risk; the 1997 season produced Hurricane Pauline, among the deadliest in Mexican history.
Global Temperature Spikes and Extreme Heat Events
El Niño years consistently rank among the warmest in the instrumental record, not only because of Pacific warming but because the event releases heat stored in the ocean into the atmosphere. The 2015-16 event coincided with the largest annual increase in atmospheric CO2 concentration on record at Mauna Loa, partly because tropical ecosystems weakened by drought released more carbon than they absorbed.
The global mean surface temperature in 2016, boosted by the strong El Niño, reached approximately 1.1°C above pre-industrial levels. The 2023-24 event helped push 2023 to become the warmest year in recorded history, with the global average exceeding the 1.5°C threshold across several months for the first time. Marine heatwaves intensified across the Pacific and Indian Oceans, triggering mass coral bleaching on the Great Barrier Reef for the second time in two years.
What the Data Shows: El Niño Intensity and Global Impacts
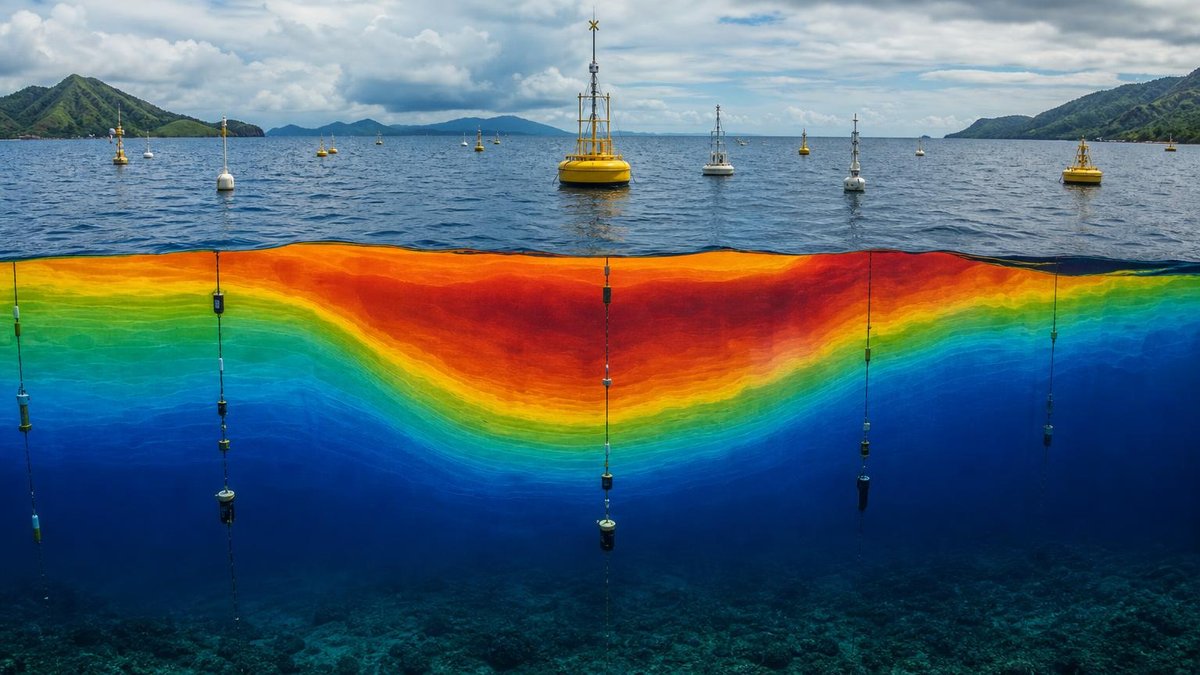
The Oceanic Niño Index (ONI), NOAA’s primary metric, classifies events by the three-month running mean of sea surface temperature anomalies in the Niño 3.4 region. The table below compares the five strongest El Niño events of the satellite era by peak ONI value and documented global impacts.
| Event Period | Peak ONI (°C) | Primary Documented Impacts |
|---|---|---|
| 2015-16 | 2.6 | Global temperature record; severe drought in Ethiopia, Indonesia; bleaching of 93% of Great Barrier Reef |
| 1997-98 | 2.4 | 23,000 deaths from storms, floods, droughts globally; $36-45 billion in damages; extreme Indonesian wildfires |
| 1982-83 | 2.2 | Drought in southern Africa, India, Australia; flooding in Peru, Ecuador, U.S. Gulf Coast; 2,000+ deaths |
| 1972-73 | 2.0 | Soviet grain harvest collapse; Sahel drought intensification; global food price crisis |
| 2023-24 | 2.0 | Record global temperatures; Canadian wildfire season of unprecedented extent; Horn of Africa drought recovery delayed |
These figures illustrate why strong El Niño events consistently rank among the costliest natural climate phenomena. The 1997-98 event alone, according to the World Meteorological Organization, caused more deaths and economic losses than any previous climate episode of its kind.
Adapting to an El Niño-Altered Future

As baseline temperatures rise, each El Niño builds on a warmer foundation. The 2023-24 event demonstrated this clearly: its peak ONI matched moderate historical events, yet it produced global temperature anomalies that would’ve seemed extraordinary during stronger events of past decades.
Communities worldwide are developing more sophisticated responses. Early warning systems for drought and flood now operate with lead times of several months, thanks to improved ENSO prediction skill. Agricultural insurance products indexed to rainfall or vegetation health help buffer smallholder losses. Urban infrastructure designs increasingly account for extreme precipitation resilience, recognizing that El Niño can deliver rainfall intensity outside historical experience.
International coordination has advanced as well. The World Meteorological Organization’s Global Producing Centres for Long-Range Forecasts issue consensus outlooks that national meteorological services translate into local guidance. Yet gaps remain; many vulnerable regions, particularly in sub-Saharan Africa and small island states, lack the institutional capacity to act on forecasts even when skill is high.
Individual and community preparedness also matters. Sustainable living practices that reduce resource consumption can buffer households against price spikes in food and energy that often accompany El Niño disruptions. Water conservation, local food production, and energy efficiency gain additional rationale when global supply chains face climate stress.
Frequently Asked Questions
Understanding El Niño’s Global Reach
How does El Niño differ from La Niña, and can they both affect global weather?
El Niño and La Niña represent opposite phases of the ENSO cycle. La Niña features cooler-than-average sea surface temperatures in the central-eastern tropical Pacific, and its impacts are often roughly inverse to El Niño’s: wetter conditions in Australia and Indonesia, drier conditions along the Pacific coast of South America, and generally more Atlantic hurricane activity. Both phases redistribute global weather patterns, though El Niño’s warm-phase impacts tend to be more dramatic and costly.
Is climate change making El Niño events stronger or more frequent?
The IPCC’s Sixth Assessment Report found no clear evidence that El Niño frequency has changed due to human-caused warming, but noted medium confidence that the amplitude of sea surface temperature variability may increase. More certain is that each El Niño now produces greater absolute temperature extremes because it adds to a warmer baseline. The interaction between ENSO and longer-term warming trends remains an active research frontier.
How far in advance can scientists predict an El Niño event?
Prediction skill varies through the annual cycle. The “spring predictability barrier” means forecasts issued between March and May have reduced reliability. By mid-year, six-to-nine month predictions achieve useful skill, with the strongest events typically becoming apparent earliest. Subseasonal prediction of El Niño’s specific impacts, however, remains far more challenging than predicting the oceanic warming itself.
Practical Implications and Responses
Several regions consistently experience severe agricultural impacts:
- Eastern Australia, where winter grain crops and livestock pasture depend on reliable cool-season rainfall
- The Horn of Africa, where consecutive failed rainy seasons during El Niño can trigger famine conditions
- India’s rain-fed agricultural regions, home to hundreds of millions of smallholder farmers
- Central America and the Caribbean, where the “canícula” mid-summer drought often intensifies
- Southern Africa, where maize production shows strong negative correlation with El Niño
The 2015-16 event contributed to food insecurity affecting tens of millions across these regions simultaneously, demonstrating how El Niño can stress global food systems at multiple points.
What can communities do to prepare before an El Niño develops?
Effective preparation spans multiple time horizons and scales:
- Governments can pre-position food reserves, update drought contingency plans, and brief emergency services before peak impact seasons
- Water utilities can draw down reservoirs strategically to create flood storage capacity where heavy rains are expected
- Farmers can adjust planting dates, select drought or flood-tolerant varieties, and diversify income sources when forecasts indicate elevated risk
- Households can maintain emergency supplies, review insurance coverage, and understand local evacuation routes
The most resilient responses integrate El Niño preparedness into ongoing climate adaptation rather than treating each event as a surprise.
Are there any unexpected regions that feel El Niño effects?
Yes, several less obvious connections exist. Northeast Brazil sometimes experiences drought through an atmospheric teleconnection. Even the Antarctic Peninsula shows statistical relationships, with some El Niño events associated with ice shelf weakening through atmospheric wave propagation. The global interconnectedness of climate systems means that few regions remain entirely untouched, even if impacts are sometimes subtle.
Sources
- Intergovernmental Panel on Climate Change, 2021. Climate Change 2021: The Physical Science Basis, Chapter 4: Water Cycle Changes. https://www.ipcc.ch/report/ar6/wg1/downloads/report/IPCC_AR6_WGI_Chapter_04.pdf
- NOAA Climate Prediction Center, 2024. Cold & Warm Episodes by Season (Oceanic Niño Index historical data). https://www.cpc.ncep.noaa.gov/products/analysis_monitoring/ensostuff/ONI_v5.php
- NOAA National Centers for Environmental Information, 2024. Global Climate Report, Annual 2023. https://www.ncei.noaa.gov/access/monitoring/monthly-report/global/202313
- NASA Goddard Institute for Space Studies, 2024. GISS Surface Temperature Analysis (GISTEMP v4). https://data.giss.nasa.gov/gistemp/
- World Meteorological Organization, 1999. The 1997-1998 El Niño Event: A Scientific and Technical Retrospective. https://library.wmo.int/doc_num.php?explnum_id=2950
- McPhaden, M.J., Zebiak, S.E., and Glantz, M.H., 2006. “ENSO as an Integrating Concept in Earth Science.” Science, 314(5806), 1740-1745. https://doi.org/10.1126/science.1132588
- Wang, G., et al., 2017. “Continued increase of extreme El Niño frequency long after 1.5°C warming stabilization.” Nature Climate Change, 7, 568-572. https://doi.org/10.1038/nclimate3351


Dr. Alexander Tabibi is an entrepreneur, investor, and advocate for sustainable innovation with a deep commitment to leveraging technology for environmental and social good. As a thought leader at the intersection of business and sustainability, Dr. Tabibi brings a strategic vision to Green.org, helping guide its mission to inspire global climate awareness and actionable change.
With a background in both medicine and business, Dr. Tabibi combines analytical rigor with entrepreneurial insight.